
How to Use Google Analytics: A Complete Guide for Beginners
Google Analytics is one of the most powerful and essential tools for tracking and analyzing website performance. Whether you’re a digital marketer, a business owner, or a content creator, understanding how to use Google Analytics is crucial to optimize your online presence. In this guide, we’ll walk you through the process of setting up Google Analytics, understanding its key features, and using it to make data-driven decisions that boost your website’s success.
What is Google Analytics?
Google Analytics is a free tool offered by Google that helps you track and analyze traffic to your website. By using Google Analytics, you can gain insights into how visitors find and interact with your website, including details such as their location, behavior, and the devices they use. This data is essential for improving user experience, optimizing your content, and driving more conversions.
The platform allows you to monitor real-time data, set up custom reports, and understand user behavior in-depth. With this data at your fingertips, you can make better decisions for your business.
Setting Up Google Analytics
1. Create a Google Analytics Account
Before you can start collecting data, you need to create a Google Analytics account. Here’s a quick guide:
-
Go to the Google Analytics website.
-
Sign in with your Google account, or create one if you don’t have one already.
-
Click Start Measuring, and provide the necessary details about your website, such as its name, URL, and time zone.
Once your account is created, you’ll receive a tracking ID and a piece of tracking code. This code needs to be added to your website in order to begin tracking visitors.
2. Install the Tracking Code
To track website data, you need to add the Google Analytics tracking code to your site. Depending on your website’s platform, you can use different methods to install the code:
-
For WordPress: You can use plugins like MonsterInsights to easily integrate Google Analytics with your site.
-
For other platforms: Paste the tracking code directly into the header of your website, just before the closing </head> tag.
After installing the tracking code, give it some time to start collecting data. You can verify if it’s working by checking the Real-Time section in Google Analytics.
Understanding Google Analytics Dashboard
The Google Analytics dashboard provides a comprehensive overview of your website’s performance. Here’s a breakdown of the key sections:
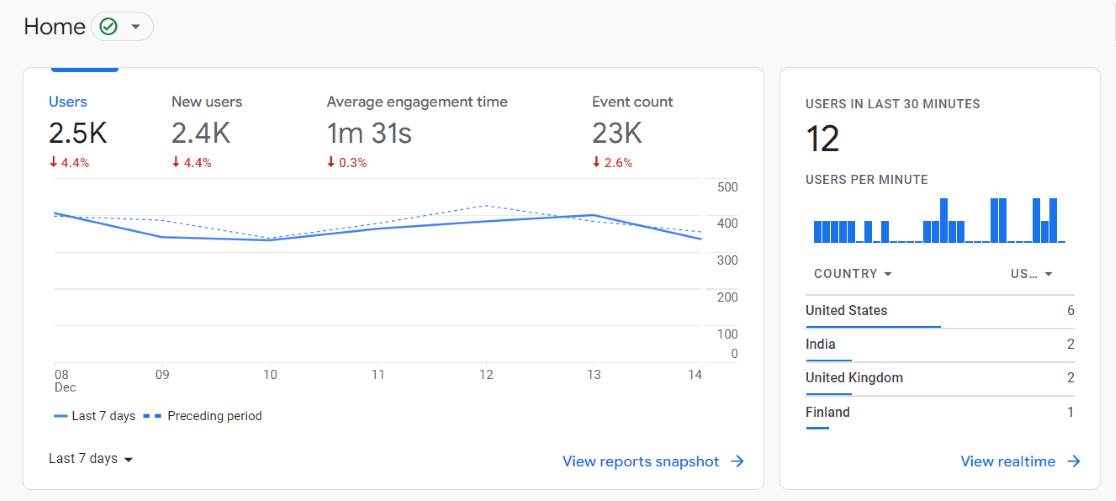
1. Real-Time Report
The Real-Time report shows you how many visitors are on your site at any given moment. This feature is especially useful for monitoring live events, promotions, or social media campaigns. It provides information on the number of active users, where they are coming from, and what pages they are viewing.
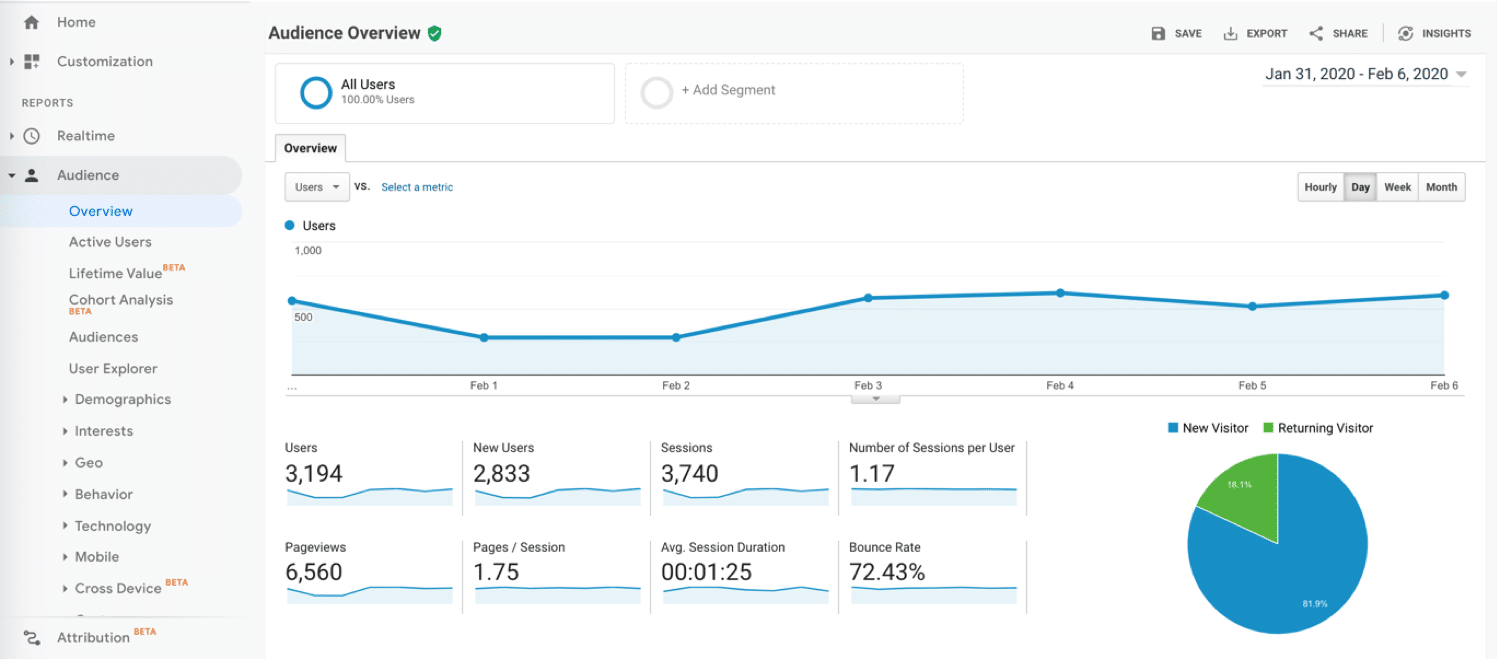
2. Audience Overview
The Audience Overview gives insights into your site’s visitors, including:
-
User demographics: Age, gender, and location.
-
Devices used: Desktop, mobile, or tablet.
-
Acquisition channels: How visitors found your website (organic search, paid ads, social media, etc.).
This section is crucial for understanding your audience and tailoring your content to meet their needs.
3. Acquisition Report
The Acquisition report helps you understand how visitors are finding your website. It breaks down traffic sources into categories such as:
-
Organic search: Visitors from search engines like Google.
-
Direct traffic: Visitors who typed your URL directly into their browser.
-
Referral traffic: Visitors who clicked on links from other websites.
-
Social media: Visitors from platforms like Facebook, Twitter, or Instagram.
This data helps you determine which channels are most effective for driving traffic.
Key Google Analytics Metrics to Track
When using Google Analytics, there are several important metrics that can help you assess the performance of your website. Here are some key metrics to monitor:
1. Sessions
A session is a period of time during which a user is actively engaged with your website. Tracking sessions helps you understand the volume of traffic your site is receiving.
2. Users
The users metric shows how many unique individuals visited your website during a specified time period. This is crucial for assessing the reach of your site.
3. Bounce Rate
The bounce rate indicates the percentage of visitors who leave your website after viewing only one page. A high bounce rate might signal that your website’s content or design isn’t engaging enough to encourage visitors to explore further.
4. Pages per Session
Pages per session tells you how many pages visitors view during a session. A higher number indicates that users are engaging with multiple pages, which is a sign of interest in your content.
5. Conversion Rate
The conversion rate tracks the percentage of visitors who take a specific action on your site, such as making a purchase, signing up for a newsletter, or filling out a form. Monitoring this metric is crucial for determining the effectiveness of your calls-to-action (CTAs).
How to Use Google Analytics to Improve Your Website Performance
Once you’ve set up Google Analytics and begun tracking your data, it’s time to analyze the insights and use them to improve your website. Here are some strategies:
1. Improve User Experience
By analyzing metrics such as bounce rate and pages per session, you can identify problem areas on your site. For example, if users are leaving your site quickly, it might indicate that your landing page needs improvement. You can experiment with different page layouts, copy, and CTAs to increase engagement.
2. Optimize Content Strategy
The Audience Overview and Acquisition Reports help you understand your visitors’ preferences and the types of content that perform well. Use this data to optimize your content strategy by creating more of what your audience loves.
3. Track Conversions
Use goals in Google Analytics to track specific actions you want users to take, such as signing up for your newsletter or purchasing a product. By setting up conversion goals, you can track your progress and optimize your website to improve conversion rates.
Frequently Asked Questions About Google Analytics
1. What is the difference between users and sessions in Google Analytics?
In Google Analytics, a user refers to a unique individual who visits your website, while a session represents a period of interaction with your site. A single user can have multiple sessions.
2. How can I track goals in Google Analytics?
To track goals in Google Analytics, go to the Admin section and click on Goals under the View column. From there, you can set up specific actions you want to track, such as purchases or form submissions.
3. What is a bounce rate, and why is it important?
The bounce rate is the percentage of visitors who leave your website after viewing only one page. A high bounce rate can indicate that your site’s content or user experience needs improvement.
4. Can I use Google Analytics for eCommerce tracking?
Yes, Google Analytics offers eCommerce tracking that allows you to monitor transactions, product performance, and shopping behavior on your website. You’ll need to enable eCommerce tracking in your Google Analytics settings and integrate it with your website.
Conclusion
Google Analytics is an invaluable tool for understanding and improving your website’s performance. With its in-depth insights into user behavior, traffic sources, and conversion metrics, you can make data-driven decisions that optimize your online presence. By following the steps outlined in this guide, you’ll be able to harness the full potential of Google Analytics to drive growth for your website and business.
Don’t forget to regularly check your Google Analytics reports and tweak your strategies based on the data to continue improving your website’s performance!